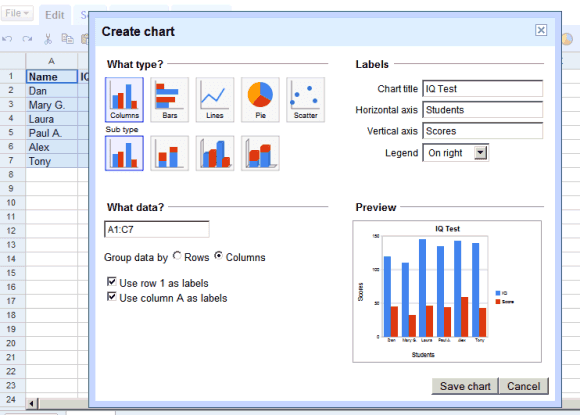
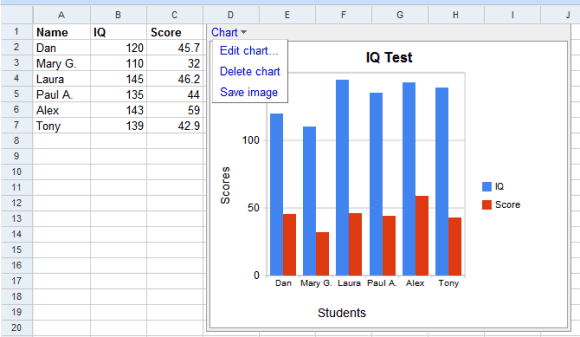
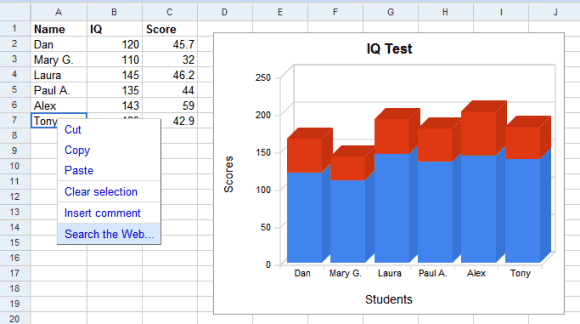
You can create more types of charts: columns, bars, lines, pie, scatter, add labels and a legend. Just select the columns you want to plot and click on the new chart icon. After inserting the chart in the spreadsheet, you can save it as a PNG image or edit it.
The charts are rendered as SVG in Firefox/Opera and VML in Internet Explorer, so they don't require plug-ins. As usually, Opera is not officially supported, so you'll find things that don't work as expected.
You can annotate cells and search using Google the text from a cell.
No comments:
Post a Comment